Pennsylvania has the 10th largest population of eligible Latino voters in the U.S. Approximately 579,000 Latinos are of voting age in the commonwealth, representing 6% of the state’s electorate.
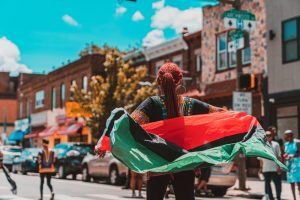
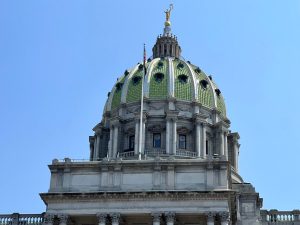
Pennsylvania is positioned to play a critical role in the 2024 election as a key battleground state. And the state’s ever-growing Latino population could be the deciding factor in the race between Democratic Vice President Kamala Harris and Republican former President Donald Trump.
According to data released by the UCLA Latino Policy and Politics Institute, Pennsylvania has the 10th largest population of eligible Latino voters in the U.S. The state has 579,000 Latino voters, representing 6% of the electorate.
In 2020, President Joe Biden won the commonwealth’s 20 electoral votes by 81,000 votes. Latino voters favored Biden over the incumbent Trump by a 3-to-1 margin.
This year, the commonwealth has 19 electoral votes up for grabs.
Pennsylvania’s Latino population has been steadily increasing since 1970, more than doubling in size since 2000.
In 2023 in Pennsylvania, there were more than 1.1 million Hispanics/Latinos (of all racial backgrounds) in the state, representing 8.9% of the total population, according to the U.S. Census Bureau vintage data estimates.
Philadelphia County has the highest number of Hispanics/Latinos (244,555), followed by Berks County (109,612), and Lehigh County (108,152).
When it comes to the ratio of Hispanic to non-Hispanic population, Lehigh County had the highest percentage (28.63%), followed by Berks County (25.33%), and Monroe County (18.7%).
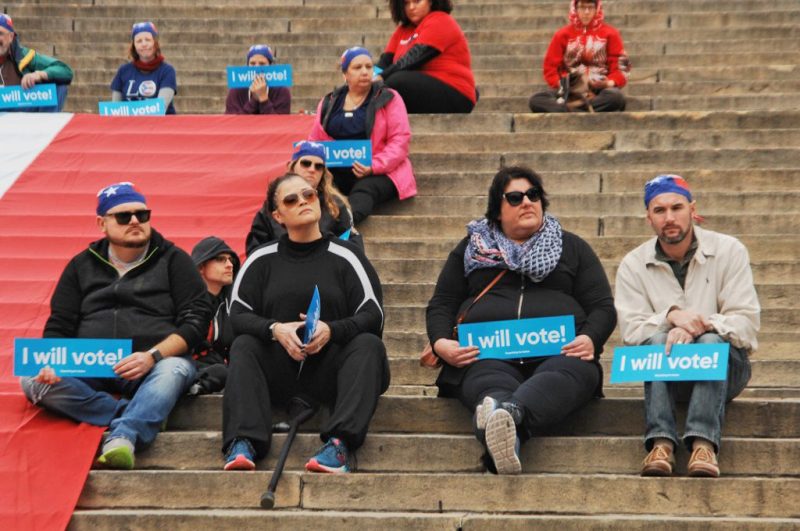
As Pennsylvania’s Latino population grows, so does the number and share of eligible voters in that particular population demographic. The state’s eligible Latino voter population has also more than doubled since 2000, increasing from 208,000 in 2000 to 579,000 in 2022.
The Latino share of Pennsylvania’s eligible voters more than doubled from about 2% in 2000 to almost 6% in 2022. Latino voter growth has outpaced that of non-Latinos, who only saw a 5% increase in the same period.
In a UnidosUS survey conducted on Latino voters in Pennsylvania, some of their top policy issues included jobs and the economy, rising cost of living, immigration, and abortion.