
Photo courtesy of Canva
When Purdue Pharma first began sales of OxyContin in the late 1990s, it was advertised as relief for cancer patients and people with chronic pain. Aggressive marketing fueled the drug’s popularity, along with that of other opioid pain management drugs on the market. But as the company touted OxyContin to physicians, it downplayed the drug’s addictiveness, according to confidential Justice Department reports obtained by news organizations, leading to widespread use that has fueled an opioid epidemic across the U.S.
More than 645,000 people have died from opioid-related overdoses between 1999 and 2021, according to the Centers for Disease Control and Prevention. Provisional data shows just under 80,000 people died in 2022 alone.
Opioid prescriptions have decreased dramatically over the past decade as physicians and public health officials learned about the dangers of OxyContin and other opioids prescribed for pain management. In 2020, the most recent year with data available, the national opioid dispense rate reached 43.3 per 100 people, the lowest rate ever recorded.
A 2022 study funded by the National Institute on Drug Abuse found that counties with higher dispensing rates had more cases of opioid misuse and dependence. The study suggested that reducing prescriptions at the local level can lower a community’s rate of opioid abuse or misuse.
Other studies, however, have suggested that decreasing prescriptions may have fueled a new phase of the opioid epidemic: the rise of synthetics like fentanyl. In 2020, synthetics accounted for 82% of all opioid deaths.
It’s also important to note that, as awareness has grown about the dangers of dispensing opioid prescription painkillers, more health care professionals are also prescribing medications like Suboxone–which contains buprenorphine and naloxone—for the treatment of addiction and opioid use disorders. While Suboxone is also an opioid medication, it works differently than typical opioid painkillers, blocking the effects of more powerful and addictive opioids to deter intentional misuse.
Using data from the Centers for Disease Control and Prevention, Ophelia broke down counties in every state with the highest opioid dispense rates. In the case of a tie, the county with the higher population and higher raw number is ranked higher. Data was available for 98% of counties in the United States. Overall in Pennsylvania, the opioid dispensing rate was 43.1 per 100 people, compared to 43.3 nationally.
Read the national story for additional historical context and see where other counties outside of Pennsylvania stand.
#50. Lebanon County
– Opioid dispensing rate: 27.4 per 100 people
— 36.4% lower than state average
— 36.7% lower than national average
#49. Jefferson County
– Opioid dispensing rate: 27.8 per 100 people
— 35.5% lower than state average
— 35.8% lower than national average
#48. Chester County
– Opioid dispensing rate: 28.8 per 100 people
— 33.2% lower than state average
— 33.5% lower than national average
#47. Berks County
– Opioid dispensing rate: 29.6 per 100 people
— 31.3% lower than state average
— 31.6% lower than national average
#46. Butler County
– Opioid dispensing rate: 29.7 per 100 people
— 31.1% lower than state average
— 31.4% lower than national average
#45. Monroe County
– Opioid dispensing rate: 30.0 per 100 people
— 30.4% lower than state average
— 30.7% lower than national average
#44. Indiana County
– Opioid dispensing rate: 30.6 per 100 people
— 29.0% lower than state average
— 29.3% lower than national average
#43. Centre County
– Opioid dispensing rate: 30.6 per 100 people
— 29.0% lower than state average
— 29.3% lower than national average
#42. Beaver County
– Opioid dispensing rate: 31.4 per 100 people
— 27.1% lower than state average
— 27.5% lower than national average
#41. Lancaster County
– Opioid dispensing rate: 32.8 per 100 people
— 23.9% lower than state average
— 24.2% lower than national average
#40. Tioga County
– Opioid dispensing rate: 33.0 per 100 people
— 23.4% lower than state average
— 23.8% lower than national average
#39. Elk County
– Opioid dispensing rate: 33.2 per 100 people
— 23.0% lower than state average
— 23.3% lower than national average
#38. Franklin County
– Opioid dispensing rate: 33.3 per 100 people
— 22.7% lower than state average
— 23.1% lower than national average
#37. Clarion County
– Opioid dispensing rate: 33.9 per 100 people
— 21.3% lower than state average
— 21.7% lower than national average
#36. Snyder County
– Opioid dispensing rate: 34.9 per 100 people
— 19.0% lower than state average
— 19.4% lower than national average
#35. Northumberland County
– Opioid dispensing rate: 35.5 per 100 people
— 17.6% lower than state average
— 18.0% lower than national average
#34. Potter County
– Opioid dispensing rate: 35.7 per 100 people
— 17.2% lower than state average
— 17.6% lower than national average
#33. Mifflin County
– Opioid dispensing rate: 36.2 per 100 people
— 16.0% lower than state average
— 16.4% lower than national average
#32. Warren County
– Opioid dispensing rate: 36.7 per 100 people
— 14.8% lower than state average
— 15.2% lower than national average
#31. Westmoreland County
– Opioid dispensing rate: 36.9 per 100 people
— 14.4% lower than state average
— 14.8% lower than national average
#30. York County
– Opioid dispensing rate: 37.3 per 100 people
— 13.5% lower than state average
— 13.9% lower than national average
#29. Cumberland County
– Opioid dispensing rate: 38.2 per 100 people
— 11.4% lower than state average
— 11.8% lower than national average
#28. Wyoming County
– Opioid dispensing rate: 38.6 per 100 people
— 10.4% lower than state average
— 10.9% lower than national average
#27. Bucks County
– Opioid dispensing rate: 38.9 per 100 people
— 9.7% lower than state average
— 10.2% lower than national average
#26. Lehigh County
– Opioid dispensing rate: 39.9 per 100 people
— 7.4% lower than state average
— 7.9% lower than national average
#25. Washington County
– Opioid dispensing rate: 41.1 per 100 people
— 4.6% lower than state average
— 5.1% lower than national average
#24. Lawrence County
– Opioid dispensing rate: 41.3 per 100 people
— 4.2% lower than state average
— 4.6% lower than national average
#23. Delaware County
– Opioid dispensing rate: 41.4 per 100 people
— 3.9% lower than state average
— 4.4% lower than national average
#22. Philadelphia County
– Opioid dispensing rate: 43.2 per 100 people
— 0.2% higher than state average
— 0.2% lower than national average
#21. Clinton County
– Opioid dispensing rate: 43.6 per 100 people
— 1.2% higher than state average
— 0.7% higher than national average
#20. Columbia County
– Opioid dispensing rate: 43.7 per 100 people
— 1.4% higher than state average
— 0.9% higher than national average
#19. Mckean County
– Opioid dispensing rate: 46.4 per 100 people
— 7.7% higher than state average
— 7.2% higher than national average
#18. Clearfield County
– Opioid dispensing rate: 46.4 per 100 people
— 7.7% higher than state average
— 7.2% higher than national average
#17. Montgomery County
– Opioid dispensing rate: 47.9 per 100 people
— 11.1% higher than state average
— 10.6% higher than national average
#16. Venango County
– Opioid dispensing rate: 48.8 per 100 people
— 13.2% higher than state average
— 12.7% higher than national average
#15. Luzerne County
– Opioid dispensing rate: 49.4 per 100 people
— 14.6% higher than state average
— 14.1% higher than national average
#14. Bradford County
– Opioid dispensing rate: 50.2 per 100 people
— 16.5% higher than state average
— 15.9% higher than national average
#13. Lycoming County
– Opioid dispensing rate: 50.4 per 100 people
— 16.9% higher than state average
— 16.4% higher than national average
#12. Northampton County
– Opioid dispensing rate: 50.4 per 100 people
— 16.9% higher than state average
— 16.4% higher than national average
#11. Crawford County
– Opioid dispensing rate: 53.1 per 100 people
— 23.2% higher than state average
— 22.6% higher than national average
#10. Dauphin County
– Opioid dispensing rate: 53.9 per 100 people
— 25.1% higher than state average
— 24.5% higher than national average
#9. Cambria County
– Opioid dispensing rate: 54.0 per 100 people
— 25.3% higher than state average
— 24.7% higher than national average
#8. Erie County
– Opioid dispensing rate: 56.9 per 100 people
— 32.0% higher than state average
— 31.4% higher than national average
#7. Union County
– Opioid dispensing rate: 59.1 per 100 people
— 37.1% higher than state average
— 36.5% higher than national average
#6. Allegheny County
– Opioid dispensing rate: 63.7 per 100 people
— 47.8% higher than state average
— 47.1% higher than national average
#5. Blair County
– Opioid dispensing rate: 64.9 per 100 people
— 50.6% higher than state average
— 49.9% higher than national average
#4. Lackawanna County
– Opioid dispensing rate: 65.3 per 100 people
— 51.5% higher than state average
— 50.8% higher than national average
#3. Mercer County
– Opioid dispensing rate: 70.7 per 100 people
— 64.0% higher than state average
— 63.3% higher than national average
#2. Fayette County
– Opioid dispensing rate: 81.1 per 100 people
— 88.2% higher than state average
— 87.3% higher than national average
#1. Montour County
– Opioid dispensing rate: 260.7 per 100 people
— 504.9% higher than state average
— 502.1% higher than national average
This story originally appeared on Ophelia and was produced and
distributed in partnership with Stacker Studio.
Author

Politics

Breaking down IVF: What it is and why it’s important in the fight for reproductive rights
In vitro fertilization, or IVF, has been at the forefront of a major reproductive rights battle, but what exactly is it? For many Americans, in...

Fetterman introduces bill to protect affordable internet access for 23 million households
The Affordable Connectivity Program expired on Tuesday due to Republican opposition, putting affordable high-speed internet access at risk for 23...
Democrats advance election bill in Pennsylvania long sought by counties to process ballots faster
HARRISBURG, Pa. (AP) — Pennsylvania's House of Representatives on Wednesday approved a bill long sought by counties seeking help to manage huge...

Local News

Look out, Sheetz, Wawa is officially moving into your territory with Central Pa. expansion
The Delaware County-based convenience store chain broke ground on its first Dauphin County location Wednesday in Middletown, with five more stores...
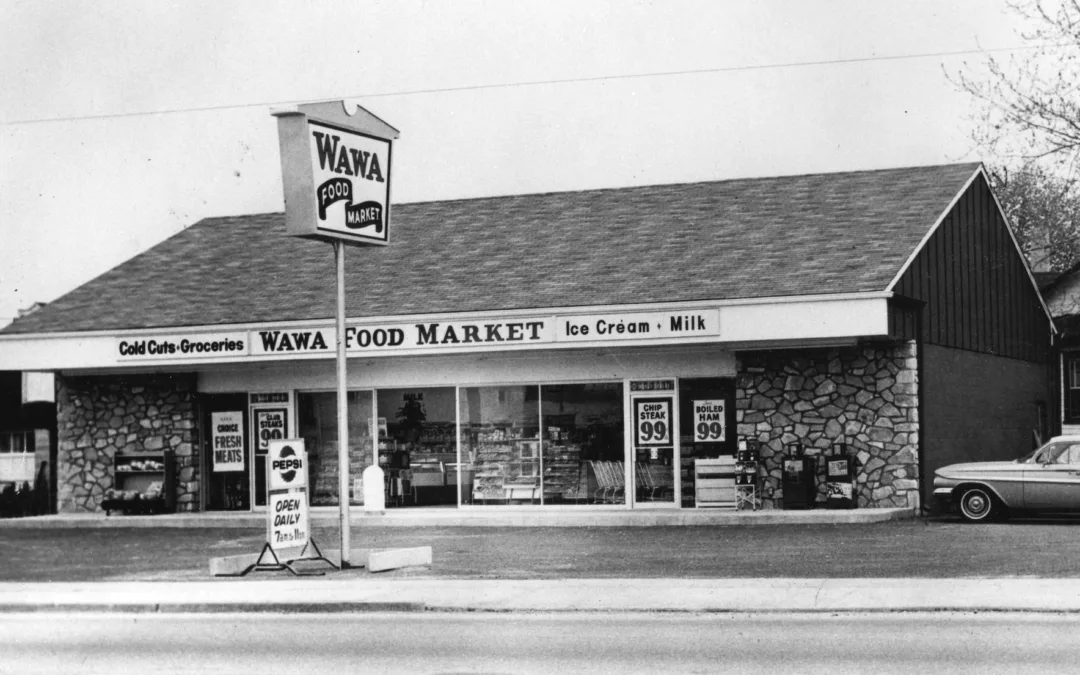
What do you know about Wawa? 7 fun facts about Pennsylvania’s beloved convenience store
Wawa has 60 years of Pennsylvania roots, and today the commonwealth’s largest private company has more than 1,000 locations along the east coast....